
Data is only as valuable as the insights you can extract from it — and in today’s world, those insights need to be fast, interactive, and visually compelling.
 Kanmeugne’s Blog : Apache Superset and Postgresql — connecting your database to a powerful data visualisation engine
Apache Superset, a powerful open-source data visualization platform, is rapidly becoming the go-to tool for analysts and developers who want to turn raw data into actionable dashboards without wrestling with complex setup processes. Thanks to Docker and Docker Compose, spinning up a full-featured Superset environment takes just a few minutes, letting you focus on what matters: connecting to your data and building beautiful, shareable dashboards.
 Kanmeugne’s Blog : Apache Superset and Postgresql — connecting your database to a powerful data visualisation engine
In this hands-on guide, you’ll see how convenient it is to connect Superset to a PostgreSQL database using Docker Compose. Once you’re comfortable with Docker basics, Superset’s streamlined workflow makes dashboard creation not just possible, but enjoyable-even for complex data sources.
I will assume you have installed Docker and Docker-compose on your computer — follow this installation guide if you haven’t, and come back to the tutorial after.
Build and run the application
- pull the application from the github repository
1
2
$ git clone https://github.com/kanmeugne/modern-data-architectures.git
$ cd modern-data-architecture/handzon-apache-superset
- create a
.envwith the required environment variables for the project :
1
2
3
4
5
6
7
8
9
10
11
12
13
14
15
16
17
18
19
# postgres variables
POSTGRES_USER=***
POSTGRES_PASSWORD=***
POSTGRES_DB=***
POSTGRES_PORT=***

# pgadmin variables
PGADMIN_DEFAULT_EMAIL=***
PGADMIN_DEFAULT_PASSWORD=***
PGADMIN_PORT=***

# superset variable
SUPERSET_SECRET_KEY=***
SUPERSET_PORT=***
SUPERSET_ADMIN_USERNAME=***
SUPERSET_ADMIN_PASSWORD=***
SUPERSET_ADMIN_EMAIL=***
SUPERSET_ADMIN_FIRST_NAME=***
SUPERSET_ADMIN_LAST_NAME=***
- download the dataset and save the file into
source_data(you need to do it before building the app) :
1
2
3
4
5
handzon-apache-superset/source_data$ curl -L -o brazilian-ecommerce.zip \
        https://www.kaggle.com/api/v1/datasets/download/olistbr/brazilian-ecommerce
handzon-apache-superset/source_data$ unzip brazilian-ecommerce.zip
...
handzon-apache-superset/source_data$ rm brazilian-ecommerce.zip
Data model of the Brazilian E-Commerce Public Dataset by Olist
- build the application with
docker composefrom the project folder :
1
2
handzon-apache-superset$ docker compose up -d
...
The build process might be long at first run, so be patient…
Database walkthrough
When everything is up, use your favorite browser and do the following checkups :
- check the database content by opening the pgadmin web endpoint in your browser :
http://localhost:<PGADMIN_PORT>. You will have to log in pgadmin with the username and the password that you have defined in the.envfile.
1
2
3
4
# pgadmin variables
PGADMIN_DEFAULT_EMAIL=***
PGADMIN_DEFAULT_PASSWORD=***
PGADMIN_PORT=***
 PGAdmin Login Page : use the credentials defined in
 .env
- navigate in your database by setting a connection with the proper variables (the server address is the name of corresponding service container :
postgis)
1
2
3
4
5
# postgres variables
POSTGRES_USER=***
POSTGRES_PASSWORD=***
POSTGRES_DB=***
POSTGRES_PORT=***
 PGAdmin Connexion + Navigation into your sql tables
Create analytics within Superset
To be able to create analytics, you should at least :
- set a database connexion
- create datasets
- create charts and add them to dashboards
Create a database connexion
Follow these steps in order to create a connexion to your postgresql database :
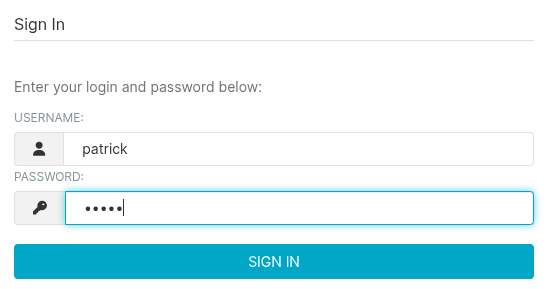
- open the superset endpoint in your browser :
http://localhost:<SUPERSET_PORT>and use the following credentials to sign in :1 2 3
SUPERSET_PORT=*** SUPERSET_ADMIN_USERNAME=*** SUPERSET_ADMIN_PASSWORD=***
![img-description]() login into Superset
login into Superset - when signed in, go to
(1) + > (2) Data > (3) Connect databaseto configure a new database connexion
 login into Superset
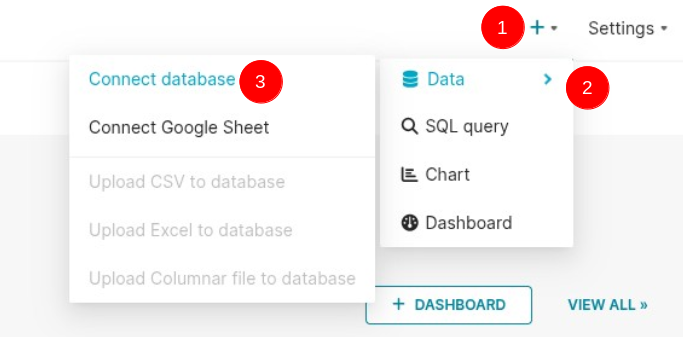 add connexion to the database - select data source
- click on the
Postgresqlbutton since we are using a Postgresql Database
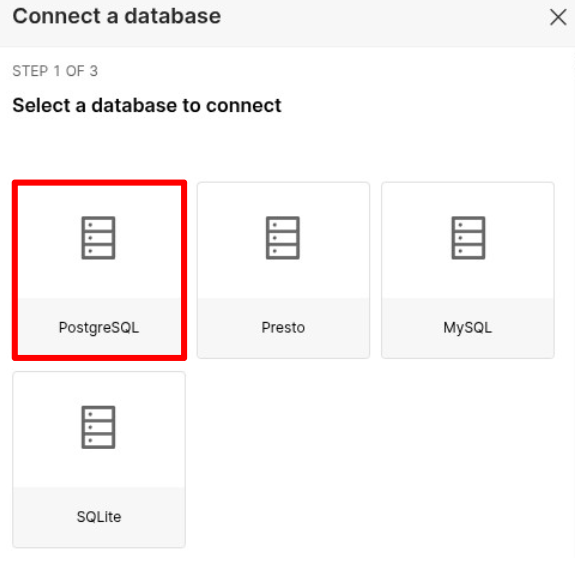 add connexion to the database - select database type
- use the postgresql credentials from the
.envand click Connexion, then Finish buttons.
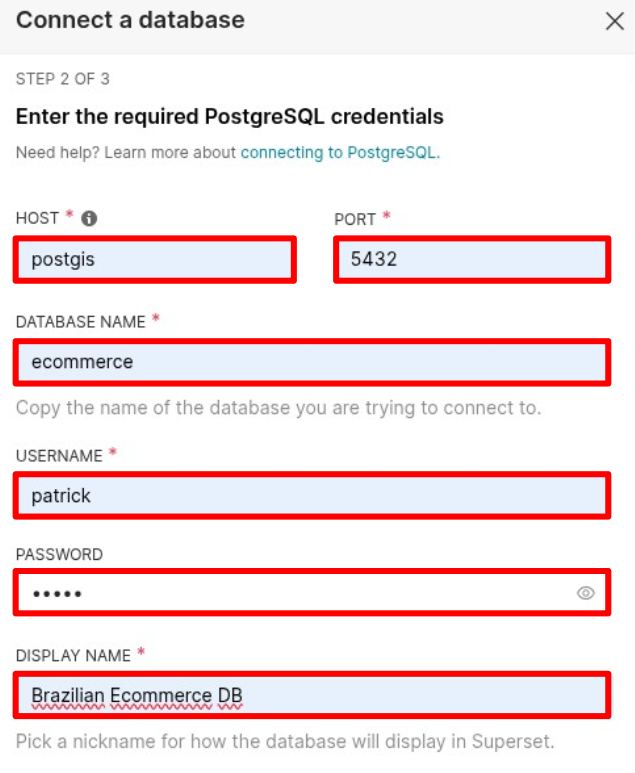 add connexion to the database - set credential and save the connexion
Within the tool, you can now query data from the database and build the analytics upon it.
Create a dataset
Datasets can be created either directly from sql table or from sql queries. In this tutorial, we are going to create one from a sql query :
- Go to the Menu
(1) SQL>SQL Lab, to open the sql dataset creation wizard. - Use the
(2) DATABASEfield to select the database connexion you just created - Use
(3) SCHEMAfield to pick the right schema.
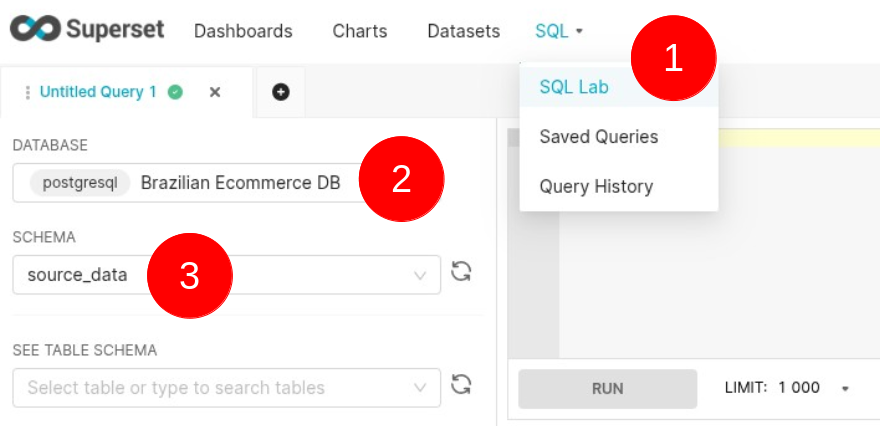 create the query to be used as the dataset
- In the right panel, copy the following sql code to collect relevant data about orders, products and sellers
1
2
3
4
5
6
7
8
9
SELECT
  oi.order_id, oi.product_id,
  tr.product_category_name_english as product_name,
  oi.price, oc.customer_city
from olist_order_items_dataset  oi
   inner join olist_orders_dataset oo on oo.order_id = oi.order_id
   inner join olist_customers_dataset oc on oo.customer_id = oc.customer_id
   inner join olist_products_dataset op on oi.product_id = op.product_id
   left join  product_category_name_translation tr on op.product_category_name = tr.product_category_name
- save the dataset as orders, products, sellers
Now that we have created an extended dataset on orders and products, we can edit charts and dashboards to explore it.
Create charts
Let’s create 3 charts that we are going to add to a dashboard later.
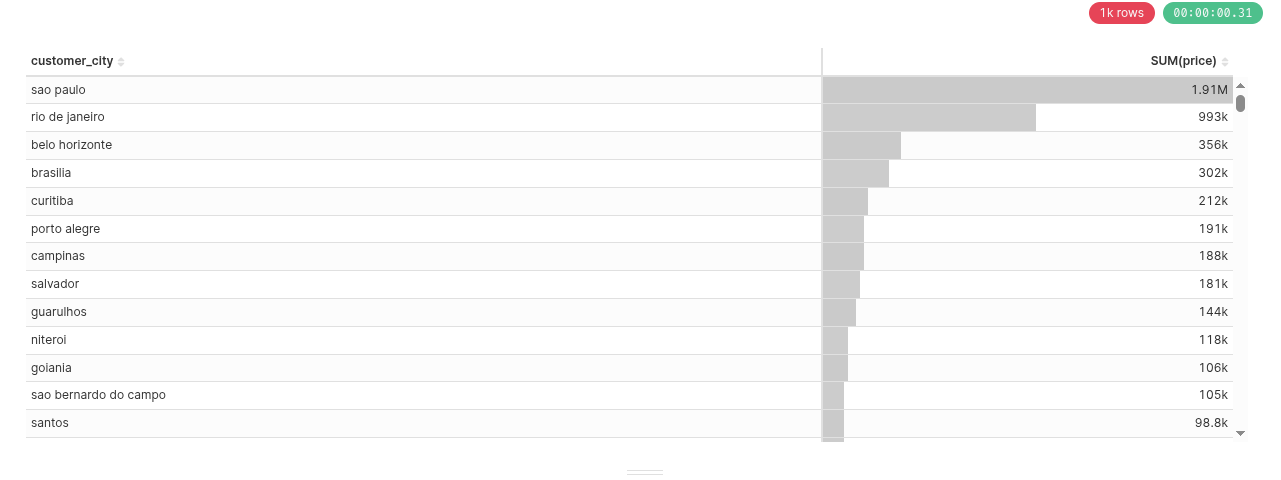
$1^{st}$ chart : total sales per city
- on the dataset tab, click on orders, products, sellers
- drag
priceattribute from the left panel and drop it in the metrics cell - confirmSUM(price)as the agregation operation. - drag
customer_cityfrom the left panel to the Dimensions cell. You should see the following chart (see screenshot). Save it as total sales per city
 create a chart from the dataset
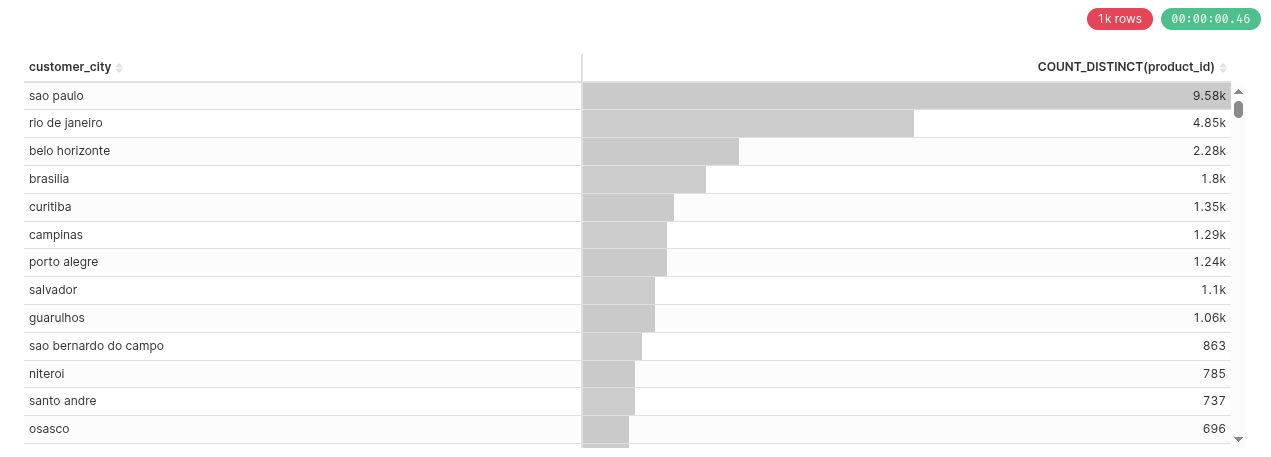
$2^{nd}$ chart : number of different products per city
- on the dataset tab, click on orders, products, sellers
- use
product_idas the metric (confirmCOUNT_DISTINCT(product_id)as the agregation operation), andproduct_nameas the dimension. You should see this chart (save it as number of different products per city)
 create a second chart from the dataset
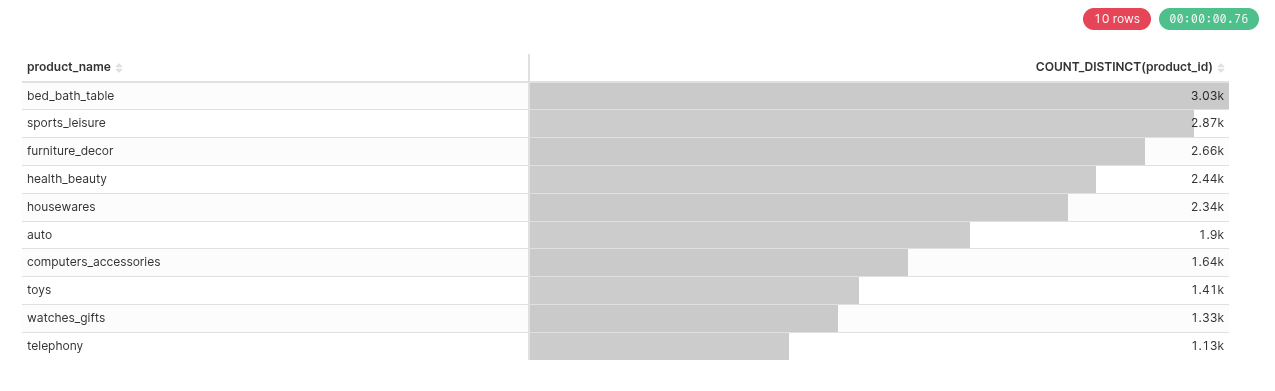
$3^{rd}$ chart : top ten sales
- on the dataset tab, click on orders, products, sellers
- use
product_idas the metric (confirmCOUNT_DISTINCT(product_id)as the agregation operation), andproduct_nameas the dimension. - use the
ROW LIMIToption to limit the number of items to10. You should see this chart (save it as top ten sales)
 create a third chart from the dataset
It is now possible to agregate charts into a dashboard to have an overview of your data
Create a dashboard
Dashboard creation is quite simple :
- on the dashboard tab, add a new dashboard
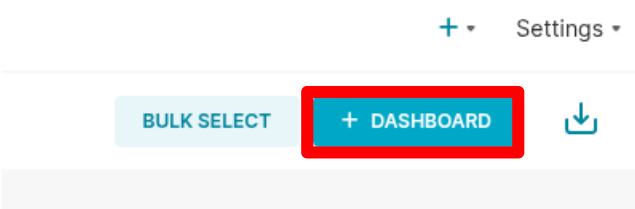 create a new dashboard
- check on the right pane to see the charts you can use to build your dashboard (you should see the charts you have created above)
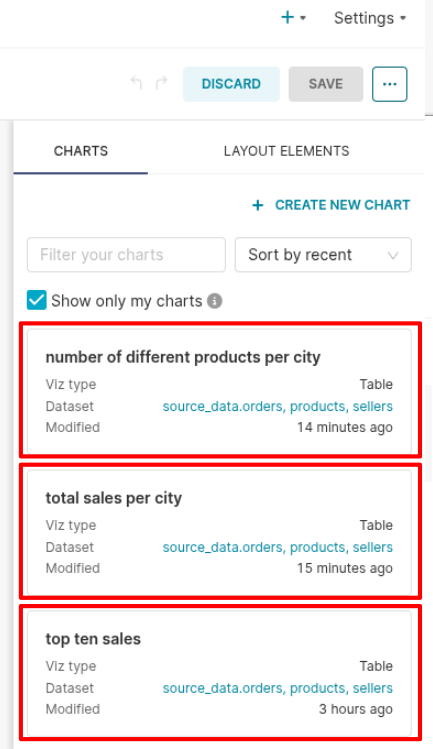 explore charts on the right panel
- drag all your charts from the right pane and drop them anywhere on the dashboard canva
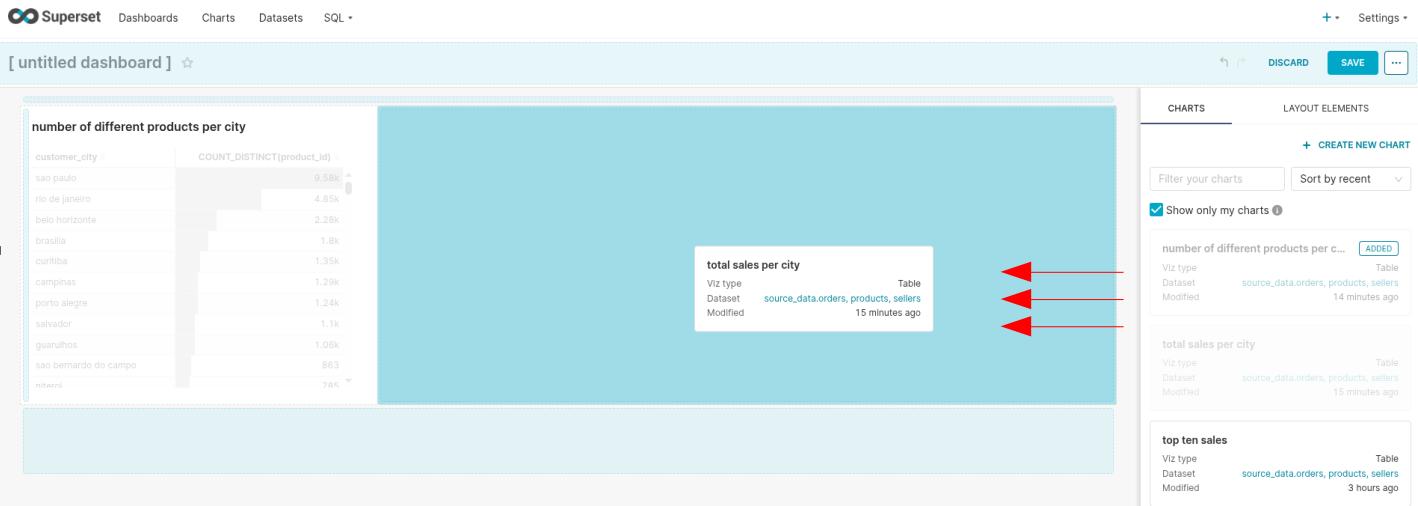 drag and drop charts into the dashboard
- save the dashboard as Product Sales View.
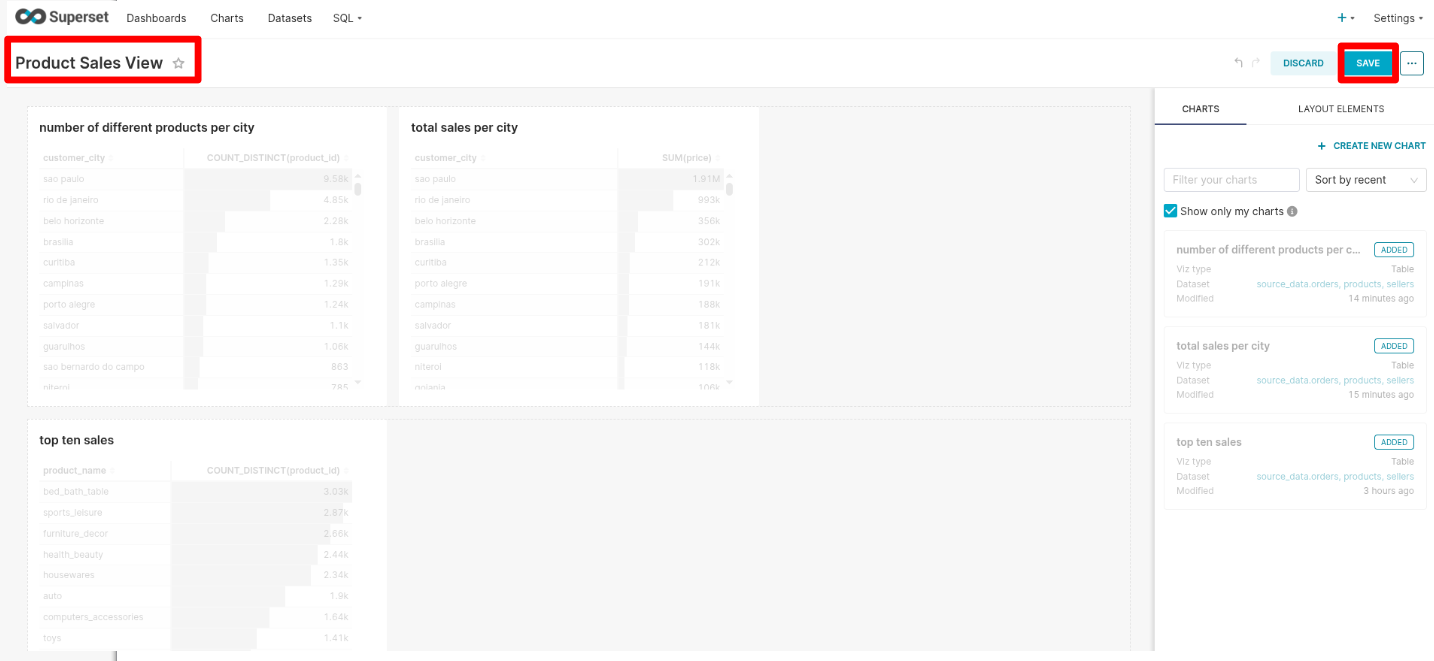 set the dashboard title and save
You should now see Product Sales View under the dashboard tab. Interested readers could check the Apache Superset website to see how to attach CSS template to get more compeling visuals.
Conclusion
I hope this tutorial will be helpful for those who want to play with Apache SuperSet and PostgreSQL. Feel free to send me your comments and remarks.